


Quick answer
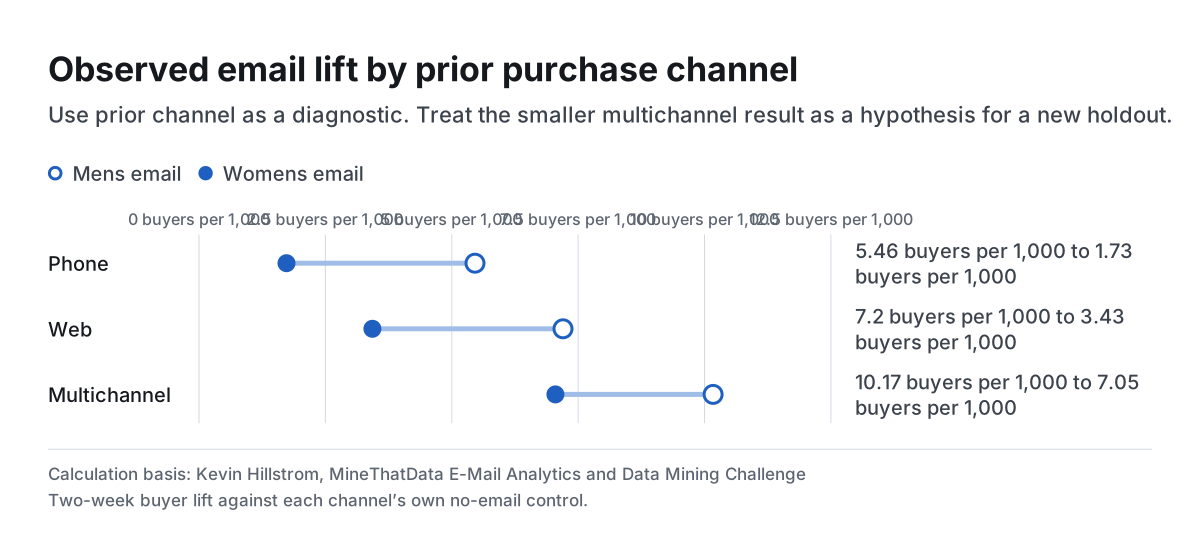
In the Hillstrom trial, Mens email added an estimated 5.46 buyers per 1,000 prior phone buyers, 7.2 per 1,000 prior web buyers and 10.17 per 1,000 multichannel buyers versus each group’s no-email holdout over two weeks. Channel describes earlier purchase behavior.
Kevin Hillstrom, MineThatData E-Mail Analytics and Data Mining Challenge
Key findings and sources
The largest Mens email lift estimate came from multichannel customers
Take Rate’s Hillstrom replay found 10.17 additional buyers per 1,000 assigned multichannel customers in the Mens email arm versus their no-email holdout over two weeks.
Kevin Hillstrom, MineThatData E-Mail Analytics and Data Mining Challenge
64,000 customers in the Hillstrom retail randomized email trial, grouped by prior purchase channel Subtract 18/2,606 from 44/2,577 and multiply by 1,000.
Prior phone and web buyers had different estimates
In Hillstrom’s retail email test, Mens email added an estimated 5.46 buyers per 1,000 past phone buyers and 7.2 per 1,000 past web buyers versus each cohort’s no-email holdout.
Kevin Hillstrom, MineThatData E-Mail Analytics and Data Mining Challenge
64,000 customers in the Hillstrom retail randomized email trial, grouped by prior purchase channel Compare conversion per assigned customer within each historical Channel group.
Womens email also showed its largest estimate in multichannel
In Hillstrom’s two-week retail trial, Womens email added an estimated 7.05 buyers per 1,000 multichannel assignments compared with the channel-matched holdout.
Kevin Hillstrom, MineThatData E-Mail Analytics and Data Mining Challenge
64,000 customers in the Hillstrom retail randomized email trial, grouped by prior purchase channel Subtract 18/2,606 from 36/2,579 and multiply by 1,000.
Keep the three historical channel denominators explicit
The Hillstrom no-email arm recorded 50 buyers in 9,327 prior phone assignments, 54 in 9,373 web assignments and 18 in 2,606 multichannel assignments.
Kevin Hillstrom, MineThatData E-Mail Analytics and Data Mining Challenge
64,000 customers in the Hillstrom retail randomized email trial, grouped by prior purchase channel Count rows and sum conversion in the no-email arm by the prior Channel field.
Compare the results
Observed email lift by prior purchase channel
Use prior channel as a diagnostic. Treat the smaller multichannel result as a hypothesis for a new holdout.
Use the baseline that belongs to the customer cohort
People who already buy across several channels may have a different natural purchase rate from those who buy online only. A direct comparison of treatment buyers can confuse those starting differences with the message effect.
The Mens email arm recorded 44 purchases among 2,577 multichannel customers, versus 18 among 2,606 no-email customers. The absolute denominators help readers see the smaller number of purchases behind the largest point estimate. The phone and web cohorts each have more than three times as many assignments per arm.
Separate the outreach from the earlier channel history
Channel records where someone had purchased over the preceding year. The experiment assigned email content, while channel came from earlier customer behavior. Moving a shopper to another sales channel would be a different intervention.
The two emails promoted different assortments. Report both against the same cohort control so product preference can remain a plausible explanation. If the business wants to learn whether the channel is actionable, set a new eligibility rule and randomize the message within each eligible group.
Plan a follow-up around actual reachable volume
Record the eligibility label before assigning a shopper. Keep the no-message control in each reporting group, and count everyone assigned, including people who never click. Compare two-week buyers and contribution per customer before choosing a rollout.
A high estimate from a small cohort can justify a targeted test. Check the number of observations needed to estimate a commercially useful difference, then repeat the test with another offer or period before making the segment permanent.
Study data
| Measure | Value | Context |
|---|---|---|
| Phone holdout assigned customers | 9,327 customers | Original CSV group sum |
| Phone holdout buyers | 50 buyers | Original CSV group sum |
| Phone holdout spend | $6,010.81 | Original CSV group sum |
| Phone Mens email assigned customers | 9,240 customers | Original CSV group sum |
| Phone Mens email buyers | 100 buyers | Original CSV group sum |
| Phone Mens email spend | $11,166.79 | Original CSV group sum |
| Phone Womens email assigned customers | 9,454 customers | Original CSV group sum |
| Phone Womens email buyers | 67 buyers | Original CSV group sum |
| Phone Womens email spend | $8,290.46 | Original CSV group sum |
| Phone Mens email incremental buyers | 5.46 buyers per 1,000 assigned | Original randomized contrast point estimate |
| Phone Womens email incremental buyers | 1.73 buyers per 1,000 assigned | Original randomized contrast point estimate |
| Web holdout assigned customers | 9,373 customers | Original CSV group sum |
| Web holdout buyers | 54 buyers | Original CSV group sum |
| Web holdout spend | $6,292.90 | Original CSV group sum |
| Web Mens email assigned customers | 9,490 customers | Original CSV group sum |
| Web Mens email buyers | 123 buyers | Original CSV group sum |
| Web Mens email spend | $14,442.21 | Original CSV group sum |
| Web Womens email assigned customers | 9,354 customers | Original CSV group sum |
| Web Womens email buyers | 86 buyers | Original CSV group sum |
| Web Womens email spend | $10,174.37 | Original CSV group sum |
| Web Mens email incremental buyers | 7.2 buyers per 1,000 assigned | Original randomized contrast point estimate |
| Web Womens email incremental buyers | 3.43 buyers per 1,000 assigned | Original randomized contrast point estimate |
| Multichannel holdout assigned customers | 2,606 customers | Original CSV group sum |
| Multichannel holdout buyers | 18 buyers | Original CSV group sum |
| Multichannel holdout spend | $1,604.62 | Original CSV group sum |
| Multichannel Mens email assigned customers | 2,577 customers | Original CSV group sum |
| Multichannel Mens email buyers | 44 buyers | Original CSV group sum |
| Multichannel Mens email spend | $4,702.69 | Original CSV group sum |
| Multichannel Womens email assigned customers | 2,579 customers | Original CSV group sum |
| Multichannel Womens email buyers | 36 buyers | Original CSV group sum |
| Multichannel Womens email spend | $4,573.28 | Original CSV group sum |
| Multichannel Mens email incremental buyers | 10.17 buyers per 1,000 assigned | Original randomized contrast point estimate |
| Multichannel Womens email incremental buyers | 7.05 buyers per 1,000 assigned | Original randomized contrast point estimate |
What changes when you compare the figures
| Comparison | Result | Calculation |
|---|---|---|
| Phone Mens email incremental buyers | 5.46 buyers per 1,000 assigned | = (100 / 9240 - 50 / 9327) * 1000 |
| Phone Mens email spend lift | 0.56 USD per assigned customer | = (11166.79 / 9240 - 6010.81 / 9327) * 1 |
| Phone Womens email incremental buyers | 1.73 buyers per 1,000 assigned | = (67 / 9454 - 50 / 9327) * 1000 |
| Phone Womens email spend lift | 0.23 USD per assigned customer | = (8290.46 / 9454 - 6010.81 / 9327) * 1 |
| Web Mens email incremental buyers | 7.2 buyers per 1,000 assigned | = (123 / 9490 - 54 / 9373) * 1000 |
| Web Mens email spend lift | 0.85 USD per assigned customer | = (14442.21 / 9490 - 6292.9 / 9373) * 1 |
| Web Womens email incremental buyers | 3.43 buyers per 1,000 assigned | = (86 / 9354 - 54 / 9373) * 1000 |
| Web Womens email spend lift | 0.42 USD per assigned customer | = (10174.37 / 9354 - 6292.9 / 9373) * 1 |
| Multichannel Mens email incremental buyers | 10.17 buyers per 1,000 assigned | = (44 / 2577 - 18 / 2606) * 1000 |
| Multichannel Mens email spend lift | 1.21 USD per assigned customer | = (4702.69 / 2577 - 1604.62 / 2606) * 1 |
| Multichannel Womens email incremental buyers | 7.05 buyers per 1,000 assigned | = (36 / 2579 - 18 / 2606) * 1000 |
| Multichannel Womens email spend lift | 1.16 USD per assigned customer | = (4573.28 / 2579 - 1604.62 / 2606) * 1 |
Methodology and sources
Use all public Hillstrom rows. Group by prior-year purchase channel and randomized email arm. Divide buyers by all assigned rows and subtract the no-email purchase rate in the same channel. Multiply by 1,000. Calculate spend per assigned customer separately. Include zero outcomes and avoid conditioning on visits. Compare subgroup point estimates descriptively.
Download the source data (CSV)
Download the calculations (CSV)
Download the citation notes (CSV)
Download the evidence behind the new findings (CSV)
Related reading
Revenue lift statistics for ecommerce experiments with high-spend orders
Incremental advertising return statistics and what a holdout can tell you
Sample ratio mismatch statistics for checkout A/B tests
Sources and definitions
Kevin Hillstrom, MineThatData E-Mail Analytics and Data Mining Challenge
The source data includes the population, period, denominator and limitations for every figure.